


Changes in Student Enrollment in Indiana Public School Corporations and Charters, 2006-2024
Policy Report #25-A • January 2025
Authors
Moaaz Hamid, Dr. Michele Moore, Prof. Christopher Lubienski
Center for Evaluation and Education Policy, Indiana University
Key Takeaways
- Urban Enrollment Declines: Major urban school corporations like Indianapolis Public Schools and Gary Community School Corporation continue to face declining enrollment due to complex economic, demographic, and policy factors, underscoring the need for urban education policies to adapt to changing circumstances.
- Suburban Growth: Enrollment growth in suburban corporations such as Hamilton Southeastern, Brownsburg, and Westfield-Washington reflects housing development and shifting population patterns, suggesting the need for scalable infrastructure and long-term planning.
- Shifts in Charter School Enrollment: Notable enrollment increases in some charter schools, particularly online charter schools, highlight evolving enrollment dynamics. However, the reasons behind these shifts remain uncertain and require deeper investigation into school choice policies, enrollment patterns, and state-level policies. This trend should be interpreted cautiously to avoid assumptions about privatization success.
- Emerging Stability: An average enrollment change of -12.57 students per corporation from 2023 to 2024 points to statewide stability, though some corporations experienced significant positive or negative shifts, indicating significant localized fluctuations.
- Small School Corporations at Risk: Many smaller corporations, with fewer than 1,000 students, face ongoing enrollment declines, raising sustainability concerns, potential funding inequities, and future consolidation risks. Charter schools with less than 1,000 enrolled do not share the same scrutiny in the legislature as public schools.
- Legislative Implications: Legislative conversations on small school corporations should include discussions on small charter schools and balance the potential benefits of consolidation with preserving access to locally controlled, community-based schools and ensuring equitable education for all students.
- Data Literacy and Mis/Disinformation Risk: The analysis reveals how different methods of calculating overall enrollment changes can lead to varying interpretations. This highlights the need for improved data literacy among education stakeholders to prevent misunderstandings in public policy debates. Consistent, transparent data analysis practices are essential for making informed decisions.
Note: This report does not include private/voucher school data. The data used is for public school corporations, including public charter schools from the IDOE website. Also, the terms school district and school corporation are used interchangeably in Indiana’s context.
Understanding enrollment trends in K-12 education, particularly in Indiana, is crucial for effective educational planning and policymaking. Nationally, public school enrollment experienced a significant decline during the COVID-19 pandemic, dropping from 50.8 million students in the fall of 2019 to 49.5 million in the fall of 2021—a decrease of approximately 1.3 million students (K-12 Dive, 2024). These national trends are mirrored in Indiana, where between 2013 and 2023, 64 of Indiana's corporations saw declines in total K-12 enrollment, with nearly half experiencing drops exceeding 10% (InContext, 2024). Factors contributing to these declines may include demographic shifts, such as lower birth rates and migration patterns, as well as expansion of charter schools and homeschooling options (Indiana Department of Education, 2024). For instance, the expansion of school choice programs in Indiana correlates with significant enrollment shifts impacting traditional public schools (CEEP, 2024).
Monitoring these enrollment changes is vital for several reasons. Accurate enrollment data ensures that funding and resources are distributed equitably among schools. It also helps in making informed decisions about school openings, closures, and facility expansions or reductions. Enrollment patterns influence class sizes, teacher-student ratios, and the availability of specialized programs, all of which affect student achievement. By analyzing these trends, stakeholders can develop strategies to address challenges such as declining enrollment, ensure efficient use of resources, and ultimately enhance the quality of education provided to students.
This report is organized to provide a comprehensive analysis of enrollment changes across Indiana school corporations from 2006 to 2024. The first section contextualizes historical enrollment trends, highlighting shifts across school corporations. Subsequent sections focus on detailed analyses, including absolute and percentage changes, weighted and unweighted metrics, and specific trends among small corporations and charter schools. Key insights are further explored through visual representations and discussions, drawing attention to legislative implications and data literacy. The report concludes with actionable takeaways and recommendations to inform policymakers and stakeholders about the nuances of enrollment shifts and their broader implications for Indiana's educational landscape.
Figure 1 illustrates the year-to-year percentage changes in total K-12 enrollment across Indiana from 2006 to 2024, without accounting for differences in their sizes. Positive bars indicate years with enrollment growth, while negative bars highlight declines. Key trends include significant drops in 2011 (-4.949%) and 2014 (-3.419%) and notable growth in 2016 (+3.754%), with smaller fluctuations in other years.
The red-dotted Ordinary Least Square (OLS) trendline suggests a slight upward trajectory over time, signaling a minuscule increase in overall enrollment. While the unweighted approach offers a straightforward view of absolute changes, it does not account for the influence of larger corporations, potentially skewing statewide representation. This plot is useful for identifying overall trends and anomalies but should be paired with weighted analyses for deeper insights.
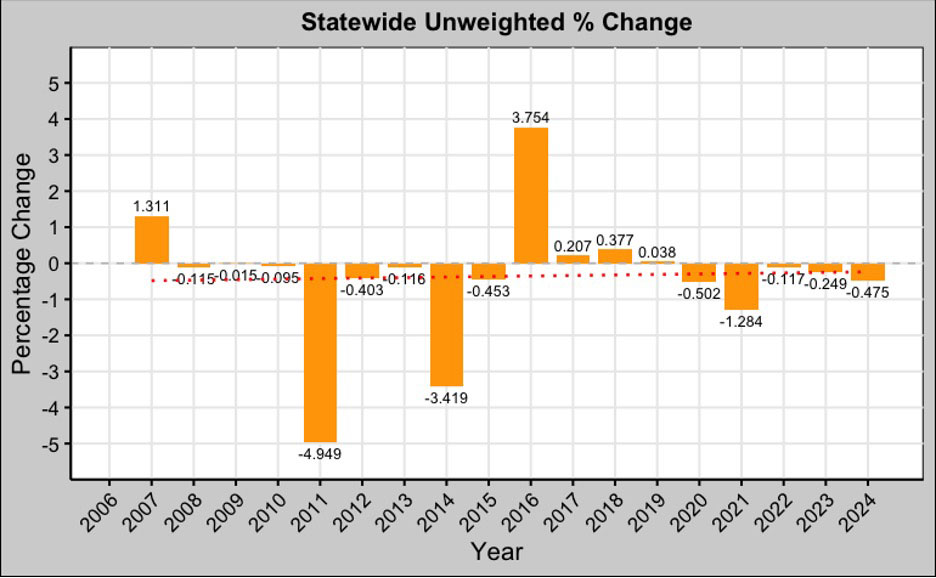
Figure 2 illustrates the year-to-year percentage change in total K-12 enrollment across Indiana, adjusted for the relative size of each corporation. This approach ensures that larger corporations have a proportionally greater impact on the overall percentage change. Positive values reflect years of enrollment growth, while negative values indicate declines.
Notable trends include initial growth in 2006 (+2.636%) followed by smaller variations in subsequent years. Significant declines were observed in 2013 (-3.624%) and 2014 (-3.451%), contrasting with modest growth from 2015 through 2020. The slight downward trend indicated by the red dotted line suggests an overall decline in weighted enrollment changes over time.
This weighted analysis provides a more nuanced view by emphasizing the influence of larger corporations. It balances the limitations of the unweighted analysis, offering a clearer picture of systemic shifts in enrollment across the state.
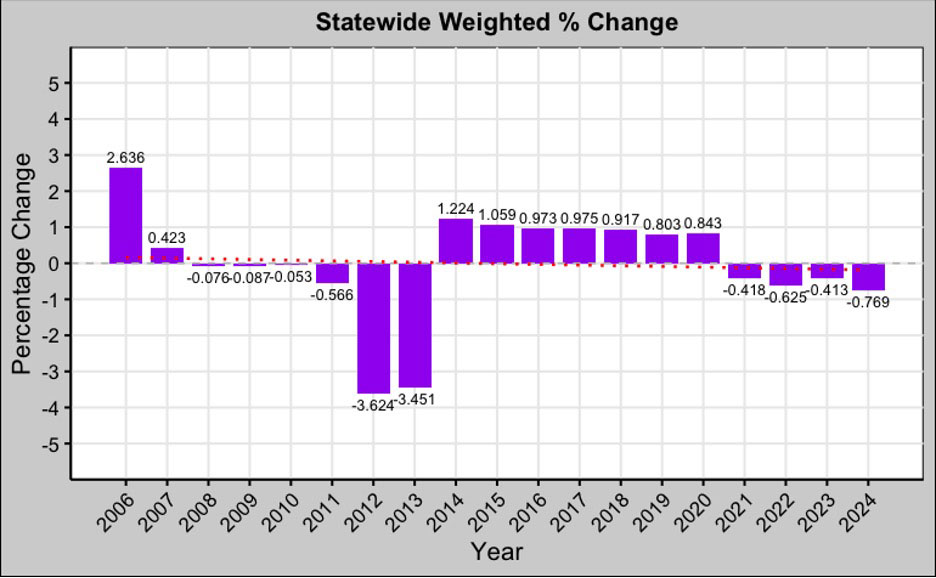
Figure 3 illustrates the unweighted average percentage change in enrollment per corporation over the years, capturing how, on average, enrollment percentages shifted across school corporations annually. Each bar represents the mean percentage change in enrollment for a typical corporation in a given year, with no consideration of corporation size. Positive values indicate years where a typical corporation, on average, experienced growth, while negative values highlight years of decline.
Key observations include significant positive peaks in 2012 (3.764%), 2019 (4.153%), and 2022 (4.739%), suggesting periods of broad enrollment growth across corporations, potentially influenced by statewide policy changes or demographic shifts. Conversely, years like 2014 (-0.586%), 2015 (-0.797%), and 2016 (-0.736%) show declines, signaling possible localized challenges or external factors impacting enrollment. The red-dotted trendline indicates a gradual upward trend over time, suggesting recovery and stabilization in average enrollment changes across corporations.
While this plot effectively highlights overall trends and average fluctuations, it does not account for corporation size. Consequently, small corporations' percentage changes carry equal weight as larger ones, potentially distorting the broader systemic impact. Despite this limitation, the plot provides valuable insight into annual enrollment dynamics at the corporation level.
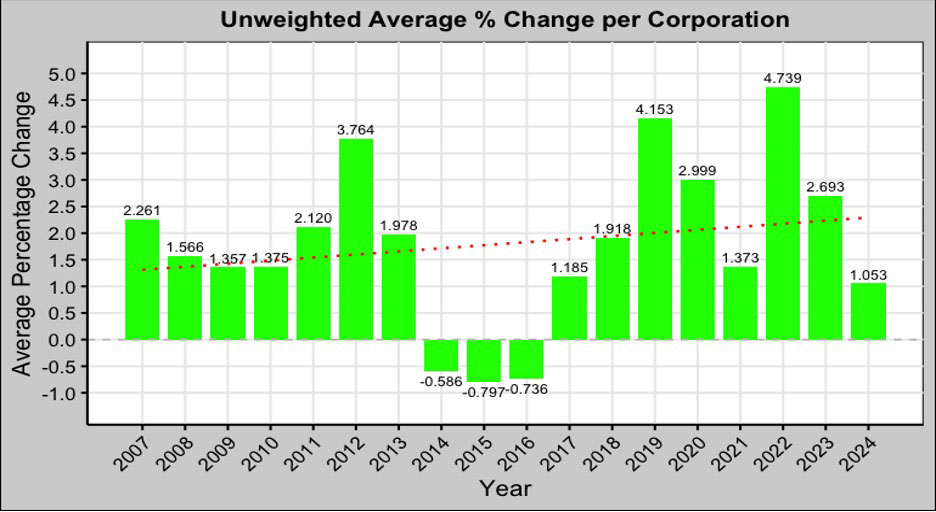
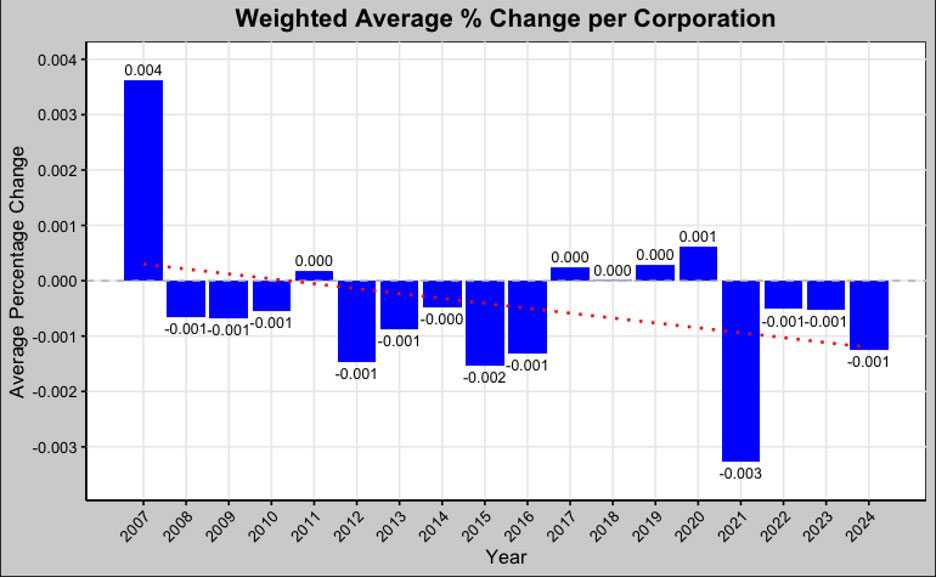
Figure 4 illustrates the yearly average percentage change in enrollment, adjusted for corporation size. By weighting each corporation's change by its enrollment, larger corporations exert greater influence, providing a system-wide perspective on enrollment dynamics.
The trend reveals a gradual decline over the years, as indicated by the red trend line. Positive growth in 2007 (0.004%) contrasts with a sharp dip in 2021 (-0.003%), reflecting notable shifts likely influenced by demographic or policy changes. Most values hover near zero, showing minimal overall growth or decline, with larger corporations driving these averages.
This weighted approach highlights systemic trends, smoothing out outliers and emphasizing changes in corporations serving larger populations. While it provides valuable insights for policymakers by focusing on broader trends, it underrepresents smaller corporations, potentially masking localized challenges. The consistent decline suggests a need to address factors contributing to reduced enrollment in prominent corporations.
The four figures collectively provide a nuanced view of enrollment dynamics across school corporations in the state from 2006 to 2024, each highlighting unique aspects of the data through distinct methodologies.
The unweighted and weighted statewide percentage change plots offer contrasting perspectives on overall enrollment trends, each serving distinct purposes for policymakers. The unweighted changes (Figure 1) represent absolute year-to-year enrollment shifts without considering the size of individual corporations. For instance, the dramatic declines in 2011 (-4.949%) and 2014 (-3.419%) and the substantial increase in 2016 (+3.754%) illustrate the raw volatility in total enrollment. These spikes highlight systemic shifts that are critical for understanding statewide trends but fail to capture how changes are distributed among small versus large corporations. Without weighting, smaller corporations exert the same influence as larger ones, which may distort the broader implications of enrollment trends.
The weighted statewide percentage changes (Figure 2), on the other hand, adjust for the size of each corporation, granting larger corporations greater influence. This approach smooths out fluctuations and provides a more representative view of statewide dynamics. For example, the tempered declines in 2013 (-3.624%) and 2014 (-3.451%) reflect the impact of enrollment shifts in larger districts. This nuanced perspective is essential for policymakers, as it emphasizes systemic trends that affect larger populations and can inform decisions about resource allocation, funding priorities, and long-term planning. The red trendline in Figure 2, indicating a gradual decline over time, underscores the need for strategic interventions to address challenges in major districts, which often serve as anchors for their communities.
The corporation-level views (Figures 3 and 4) add another layer of granularity, focusing on average enrollment dynamics across individual corporations. Figure 3, which depicts the unweighted average percentage change per corporation, highlights how a "typical" corporation experiences enrollment changes. Peaks in 2012 (3.764%), 2019 (4.153%), and 2022 (4.739%) suggest periods of widespread growth, possibly influenced by statewide initiatives or demographic shifts. Conversely, declines in 2014 (-0.586%), 2015 (-0.797%), and 2016 (-0.736%) may reflect localized challenges, such as school closures or economic downturns in certain regions. This perspective helps policymakers identify broad patterns of growth or decline across the system, although it does not differentiate between the contributions of small and large corporations.
Figure 4 provides a weighted average percentage change per corporation, emphasizing trends in larger corporations. By smoothing out variability and focusing on broader systemic trends, this analysis offers actionable insights into enrollment shifts in major districts. For example, the consistent decline in recent years reflects challenges concentrated in larger corporations, such as urban districts facing population loss or shifts to alternative education models. These insights are critical for addressing systemic inequities and ensuring that large districts, which serve diverse populations, remain stable.
The practical value of these approaches becomes evident when considering their implications for policy decisions. For example:
- Weighted analyses (Figures 2 and 4): These are invaluable for identifying systemic challenges and prioritizing resources for larger districts that impact a substantial portion of the student population. For instance, if weighted data reveals a significant decline in urban districts, policymakers can focus on urban renewal programs or targeted funding to stabilize these areas.
- Unweighted analyses (Figures 1 and 3): These provide insights into smaller or rural corporations that might otherwise be overlooked. If a small district experiences dramatic enrollment growth or decline, unweighted data can highlight this anomaly and prompt localized interventions, such as additional support for growing schools or restructuring for declining ones.
The contrasting trends between weighted and unweighted analyses highlight the importance of methodological choices in shaping our understanding of enrollment dynamics. Weighted analyses help policymakers focus on systemic challenges in larger districts, while unweighted approaches capture localized fluctuations. Together, these perspectives ensure a balanced view that can inform both statewide and corporation-specific strategies, enabling policymakers to address both broad trends and localized issues effectively.
Absolute and Percentage Change Insights between 2006 and 2024
A look at the absolute change in enrollment of all school corporations in Indiana from 2006 to 2024 reveals that a majority of corporations (199) experienced a negative change, indicating widespread enrollment declines. In contrast, 108 corporations showed positive changes.
Descriptive statistics presented in Table 1 reveal significant disparities in enrollment changes across corporations between 2006 and 2024. Absolute changes demonstrate wide variability, with some corporations losing over 16,000 students while others gained more than 7,000. On average, corporations experienced a decline of 174 students, although the high standard deviation indicates considerable differences among corporations.
Percentage changes further highlight this variability, with extreme cases showing both dramatic losses and exceptional gains driven by small initial enrollments. Weighted metrics offer a more systemic perspective by reducing the influence of outliers. The weighted average percentage change is near zero, reflecting overall stability despite localized fluctuations. Negative medians and means across most metrics suggest a general trend of declining enrollment, particularly in larger corporations. Smaller corporations, on the other hand, likely experienced more dynamic changes.
These findings underscore the importance of distinguishing between absolute and weighted changes when interpreting enrollment trends. They also highlight the need to understand the context behind these shifts, including demographic changes, economic factors, and local educational policies.
| Metric | Absolute change | Percentage Change | Weighted absolute change | Weighted % change |
| Minimum | -16,226 | -75.07 | -561.91 | -1.51 |
| Maximum | 7,369 | 1548.11 | 89.41 | 0.68 |
| Mean | -173.97 | 6.46 | -3.20 | -0.02 |
| Median | -170 | -9.82 | -0.17 | -0.02 |
| SD | 1624.36 | 106.59 | 35.74 | 0.15 |
Distribution of Enrollment Changes
Table 2 highlights the distribution of corporations with enrollment changes above and below the average based on unweighted and weighted metrics. For unweighted absolute changes, the counts are nearly balanced (154 above and 153 below), while for unweighted percentage changes, the majority (231) fall below average, indicating most corporations experienced moderate to large negative percentage shifts.
In contrast, weighted absolute changes show a strong skew, with 276 corporations above average and only 31 below, emphasizing the impact of larger corporations on enrollment trends. For weighted percentage changes, the counts are evenly distributed (154 above and 153 below), reflecting a more consistent pattern across corporations.
These results underscore the importance of weighted metrics in identifying the influence of larger corporations and reveal the need to consider both unweighted and weighted analyses for a comprehensive understanding of enrollment dynamics. By incorporating both perspectives, stakeholders can better identify localized patterns alongside broader systemic trends.
| Metric | Number of corporations above average | Number of corporations below average |
| Unweighted Absolute Change | 154 | 153 |
| Unweighted Percentage Change | 76 | 231 |
| Weighted Absolute Change | 276 | 31 |
| Weighted Percentage Change | 154 | 153 |
Corporations with the Highest Enrollment Growth
Table 3 highlights corporations with the highest unweighted absolute increases in enrollment from 2006 to 2024, focusing on those with changes exceeding 1,000 students. Alongside these absolute changes, the table also displays the corresponding percentage increases, offering a nuanced view of the growth dynamics across different corporations.
Union School Corporation stands out with the largest absolute increase of 7,369 students, reflecting an extraordinary percentage growth of 1548.11%, likely due to a very small initial enrollment or substantial population shifts. Hamilton Southeastern Schools follows with 6,856 additional students, but its percentage growth of 48.80% suggests it already had a large enrollment base. Similarly, Clarksville Community School Corporation demonstrates remarkable percentage growth of 220.54%, despite an absolute increase of 3,286 students, indicating significant expansion from a relatively smaller starting point. It is interesting to note that both Clarksville Community and Union School Corporations have online schools that have contributed substantially to the enrollment increase in these corporations.
Zionsville Community Schools and Hanover Community School Corporation exhibit strong relative growth with percentage increases of 61.26% and 62.44%, respectively. In contrast, large corporations such as Carmel Clay Schools and MSD Wayne Township, with increases of 1,747 and 1,608 students, show smaller percentage gains of 12.28% and 11.42%, reflecting their already substantial enrollment sizes in 2006.
These trends illustrate the variability in growth dynamics, where smaller corporations or those starting with a smaller baseline demonstrate significant relative growth, while larger corporations contribute more to overall student numbers. The data underscores the importance of considering both absolute and percentage changes to gain a comprehensive understanding of enrollment trends across the state.
| Corporation Name | Unweighted Absolute Change | Unweighted Percentage Change |
| Union School Corporation* | 7,369 | 1548.11 |
| Hamilton Southeastern Schools | 6,856 | 48.80 |
| Westfield-Washington Schools | 4,418 | 85.22 |
| Brownsburg Community Sch Corp | 3,506 | 52.50 |
| Avon Community School Corp | 3,291 | 45.77 |
| Clarksville Com School Corp* | 3,286 | 220.54 |
| Franklin Township Com Sch Corp | 3,123 | 40.23 |
| Zionsville Community Schools | 2,911 | 61.26 |
| Noblesville Schools | 2,631 | 34.14 |
| Northwest Allen County Schools | 2,580 | 44.64 |
| Tippecanoe School Corp | 2,514 | 22.83 |
| Center Grove Com Sch Corp | 2,247 | 30.99 |
| Crown Point Community Sch Corp | 2,192 | 32.52 |
| Clark-Pleasant Com School Corp | 2,175 | 46.61 |
| M S D Perry Township | 1,960 | 14.23 |
| Carmel Clay Schools | 1,747 | 12.28 |
| M S D Wayne Township | 1,608 | 11.42 |
| Seymour Community Schools | 1,481 | 37.61 |
| Plainfield Community Sch Corp | 1,460 | 35.17 |
| Mt Vernon Community Sch Corp | 1,353 | 40.96 |
| M S D Southwest Allen County | 1,130 | 17.77 |
| Hanover Community School Corp | 1,059 | 62.44 |
Corporations with the Largest Enrollment Declines
Table 4 provides a ranked view of school corporations that have experienced the most significant absolute declines in enrollment between 2006 and 2024. Indianapolis Public Schools leads with the largest loss of 16,226 students, reflecting a decline of 43.50% in enrollment. Similarly, Gary Community School Corporation lost 11,350 students, representing a staggering 75.07% decrease, highlighting severe challenges in sustaining enrollment.
Other notable losses include South Bend Community School Corporation with a decline of 7,488 students (-35.28%) and Anderson Community School Corporation with a reduction of 4,216 students (-42.08%). These trends suggest a consistent pattern of declining enrollment among urban and metropolitan areas, which may be linked to population migration, economic shifts, or local educational dynamics.
These data highlight systemic challenges facing larger corporations while underscoring how even smaller corporations are not immune to broader enrollment trends. Policymakers must address these trends to ensure sustainable resource allocation and equitable access to quality education across the state.
| Corporation Name | Unweighted Absolute Change | Unweighted Percentage Change |
| Indianapolis Public Schools | -16,226 | -43.49 |
| Gary Community School Corp | -11,350 | -75.07 |
| South Bend Community Sch Corp | -7,488 | -35.28 |
| Anderson Community School Corp | -4,216 | -42.08 |
| School City of Hammond | -3,526 | -24.71 |
| Fort Wayne Community Schools | -3,215 | -10.47 |
| Vigo County School Corp | -3,049 | -18.82 |
| School City of East Chicago | -2,980 | -50.07 |
| Elkhart Community Schools | -2,693 | -20.00 |
| Muncie Community Schools | -2,634 | -34.81 |
| Kokomo-Center Twp Con Sch Corp | -1,971 | -28.45 |
| Portage Township Schools | -1,831 | -21.82 |
| North Lawrence Com Schools | -1,830 | -34.27 |
| Michigan City Area Schools | -1,759 | -26.21 |
| Marion Community Schools | -1,722 | -33.59 |
| Huntington Co Com Sch Corp | -1,625 | -25.62 |
| M S D Martinsville Schools | -1,596 | -28.86 |
| Jennings County Schools | -1,490 | -28.24 |
| Mitchell Community Schools | -1,380 | -68.49 |
| Merrillville Community School | -1,242 | -17.90 |
| Richmond Community Schools | -1,227 | -22.45 |
| South Dearborn Com School Corp | -1,152 | -38.61 |
| Franklin County Com Sch Corp | -1,110 | -36.22 |
| Fayette County School Corp | -1,088 | -27.04 |
| New Castle Community Sch Corp | -1,071 | -27.13 |
| Madison Consolidated Schools | -1,035 | -30.25 |
Corporations with the Highest Percentage Enrollment Increases
Table 5 highlights corporations with the highest percentage increases in enrollment between 2006 and 2024. Union School Corporation, having recently established online schools, experienced the most dramatic growth, with a staggering 1548.11% increase, driven by an unweighted absolute change of 7,369 students. Charter schools like Options Charter School - Carmel and 21st Century Charter School of Gary saw significant percentage increases of 700.78% and 359.47%, respectively, albeit with smaller absolute changes, indicating their relatively smaller initial enrollments.
Traditional public school corporations such as Zionsville Community Schools and Brownsburg Community School Corporation reported moderate percentage gains (61.26% and 52.50%) but with substantial absolute increases, reflecting their larger baseline enrollments. These trends underscore a divergence between smaller institutions achieving high percentage growth and larger corporations contributing more significantly to overall student numbers.
The data illustrate the varying dynamics of enrollment growth, emphasizing the need to consider both absolute and percentage changes when assessing educational expansion across different types of corporations. Policymakers and stakeholders should evaluate the reasons behind this variability to address challenges and support both smaller, fast-growing institutions and larger corporations in maintaining steady growth.
| Corporation Name | Unweighted Absolute Change | Unweighted Percentage Change |
| Union School Corporation* | 7,369 | 1548.11 |
| Options Charter School - Carmel | 897 | 700.78 |
| 21st Century Charter Sch of Gary | 949 | 359.47 |
| Indpls Lighthouse Charter School | 733 | 251.89 |
| SE Neighborhood Sch of Excellence | 405 | 227.53 |
| Clarksville Com School Corp* | 3,286 | 220.54 |
| Gary Lighthouse Charter School | 690 | 183.51 |
| Christel House Academy | 576 | 160.89 |
| Irvington Community School | 563 | 155.52 |
| KIPP Indpls College Preparatory | 203 | 122.29 |
| Community Montessori Inc | 262 | 118.55 |
| East Chicago Urban Enterprise Acad | 225 | 109.76 |
| Westfield-Washington Schools | 4,418 | 85.22 |
| Timothy L Johnson Academy | 167 | 73.89 |
| Thea Bowman Leadership Academy | 355 | 71.86 |
| Cloverdale Community Schools | 988 | 68.71 |
| Hanover Community School Corp | 1,059 | 62.44 |
| Zionsville Community Schools | 2,911 | 61.26 |
| Brownsburg Community Sch Corp | 3,506 | 52.50 |
| Daleville Community Schools | 330 | 49.03 |
| Hamilton Southeastern Schools | 6,856 | 48.80 |
| Clark-Pleasant Com School Corp | 2,175 | 46.61 |
| Charles A Tindley Accelerated Schl | 112 | 46.47 |
| Avon Community School Corp | 3,291 | 45.77 |
| Northwest Allen County Schools | 2,580 | 44.64 |
| Burris Laboratory School | 200 | 42.74 |
| Mt Vernon Community Sch Corp | 1,353 | 40.96 |
| Franklin Township Com Sch Corp | 3,123 | 40.23 |
| Seymour Community Schools | 1,481 | 37.61 |
| Signature School Inc | 101 | 36.46 |
| Barr-Reeve Com Schools Inc | 264 | 35.48 |
| Plainfield Community Sch Corp | 1,460 | 35.17 |
| Lawrenceburg Com School Corp | 529 | 34.49 |
| Noblesville Schools | 2,631 | 34.14 |
| Crown Point Community Sch Corp | 2,192 | 32.52 |
| Charter School of the Dunes | 164 | 32.16 |
| Center Grove Com Sch Corp | 2,247 | 31.00 |
| Whiting School City | 248 | 30.47 |
Corporations with the Largest Below Average Percentage Enrollment Declines
Table 6 showcases corporations that experienced a below-average percentage change in enrollment from 2006 to 2024, emphasizing those with significant enrollment losses. Gary Community School Corp leads the table with the largest percentage drop of -75.07%, accompanied by a substantial unweighted absolute loss of 11,350 students. Similarly, Mitchell Community Schools and Eminence Community School Corp display steep percentage declines of -68.49% and -51.91%, respectively, illustrating severe reductions in their enrollment base.
Prominent urban corporations, such as Indianapolis Public Schools (-43.50%, a loss of 16,226 students) and South Bend Community School Corp (-35.28%, a loss of 7,488 students), highlight the challenges faced by larger corporations in retaining student populations over the years. Smaller corporations like Northeast School Corp (-49.56%) and Hamilton Community Schools (-47.50%) show similarly steep proportional declines, even if their absolute losses are lower.
The consistent trend of losses across various school corporations, both large and small, underscores widespread demographic or policy shifts impacting enrollment. These decreases may reflect local population declines, migration trends, or other external factors affecting school-age populations. The presence of rural and urban corporations in this list highlights that this issue transcends geographic boundaries. Understanding the root causes of these declines is crucial for addressing enrollment challenges and ensuring the sustainability of affected school systems.
| Corporation Name | Unweighted Absolute Change | Unweighted Percentage Change |
| Gary Community School Corp | -11,350 | -75.07 |
| Mitchell Community Schools | -1,380 | -68.49 |
| Eminence Community School Corp | -286 | -51.91 |
| School City of East Chicago | -2,980 | -50.07 |
| Northeast School Corp | -727 | -49.56 |
| Hamilton Community Schools | -313 | -47.50 |
| Attica Consolidated Sch Corp | -438 | -46.45 |
| Indianapolis Public Schools | -16,226 | -43.50 |
| Western Wayne Schools | -499 | -42.72 |
| Anderson Community School Corp | -4,216 | -42.08 |
| Rochester Community Sch Corp | -801 | -41.52 |
| Argos Community Schools | -287 | -40.83 |
| IN Sch for the Blind & Vis Impaired | -63 | -39.87 |
| North Judson-San Pierre Sch Corp | -580 | -39.67 |
| South Dearborn Com School Corp | -1,152 | -38.61 |
| Whitko Community School Corp | -734 | -38.09 |
| Medora Community School Corp | -111 | -37.12 |
| East Gibson School Corporation | -376 | -36.40 |
| North Newton School Corp | -591 | -36.28 |
| Franklin County Com Sch Corp | -1,110 | -36.23 |
| Blackford County Schools | -826 | -35.96 |
| North Miami Community Schools | -435 | -35.80 |
| South Bend Community Sch Corp | -7,488 | -35.28 |
| Muncie Community Schools | -2,634 | -34.81 |
| North Lawrence Com Schools | -1,830 | -34.27 |
| Brown County School Corporation | -777 | -34.20 |
| Marion Community Schools | -1,722 | -33.59 |
| North Adams Community Schools | -737 | -33.14 |
| Rush County Schools | -860 | -32.56 |
| Lake Ridge Schools | -733 | -32.49 |
| Lakeland School Corporation | -721 | -32.17 |
| West Central School Corp | -291 | -32.12 |
| Culver Community Schools Corp | -368 | -31.97 |
| Spencer-Owen Community Schools | -984 | -31.78 |
| Blue River Valley Schools | -255 | -30.65 |
| IN Acad for Sci Math Humanities | -89 | -30.27 |
| Madison Consolidated Schools | -1,035 | -30.25 |
| North Putnam Community Schools | -567 | -29.76 |
| Oregon-Davis School Corp | -211 | -29.76 |
| Loogootee Community Sch Corp | -319 | -29.62 |
| Crawford Co Com School Corp | -533 | -29.32 |
| South Spencer County Sch Corp | -424 | -29.18 |
| M S D Martinsville Schools | -1,596 | -28.86 |
| Elwood Community School Corp | -549 | -28.85 |
| Kokomo-Center Twp Con Sch Corp | -1,971 | -28.45 |
| Jennings County Schools | -1,490 | -28.24 |
| C A Beard Memorial School Corp | -393 | -28.13 |
| Randolph Southern School Corp | -183 | -27.94 |
| Bloomfield School District | -306 | -27.64 |
| New Castle Community Sch Corp | -1,071 | -27.13 |
| M S D Shakamak Schools | -244 | -27.05 |
| Fayette County School Corp | -1,088 | -27.04 |
| Griffith Public Schools | -710 | -26.52 |
| East Washington School Corp | -467 | -26.37 |
| Pike County School Corp | -542 | -26.23 |
| Michigan City Area Schools | -1,759 | -26.21 |
| Central Noble Com School Corp | -381 | -26.20 |
| Tri-Central Community Schools | -273 | -26.20 |
| Crothersville Community Schools | -151 | -25.86 |
| Huntington Co Com Sch Corp | -1,625 | -25.62 |
| Tipton Community School Corp | -470 | -25.45 |
| Paoli Community School Corp | -407 | -25.22 |
One-Year Trends in Indiana (2022-23 to 2023-24 school years)
Descriptive Statistics
Table 7 presents descriptive statistics for the changes in enrollment between 2023 and 2024. The absolute changes in enrollment across school corporations in Indiana range from a loss of 924 students to a gain of 806 students, with a mean change of -12.57 students, indicating a slight overall decline in enrollment. The median absolute change is -7 students, reflecting that most corporations experienced small declines, while the standard deviation of 125.69 shows significant variability in these changes.
For percentage changes, the minimum is a 56.66% decrease, while the maximum is a 141.46% increase, highlighting significant variation in relative enrollment changes. The mean percentage change is a modest 1.05%, suggesting slight overall growth in relative terms. However, the median percentage change of -0.57% indicates that many corporations experienced small decreases. The standard deviation of 12.69% shows that there is considerable variability in percentage changes across corporations. This data emphasizes the uneven nature of enrollment changes, with a mix of growth and decline among Indiana school corporations.
| Metric | Absolute Change | Percentage Change |
| Minimum | -924.00 | -56.66 |
| Maximum | 806.00 | 141.46 |
| Mean | -12.57 | 1.05 |
| Median | -7.00 | -0.57 |
| SD | 125.69 | 12.69 |
Distribution of Enrollment Changes in 2023-24
Table 8 illustrates the distribution of school corporations based on their enrollment changes from 2023 to 2024, categorized by unweighted and weighted absolute and percentage changes. For unweighted absolute changes, five corporations experienced no change, 230 had above-average changes, and 181 had below-average changes. Similarly, for unweighted percentage changes, four corporations had no change, 133 were above average, and 277 were below average. In terms of weighted absolute changes, five corporations recorded no change, 336 were above average, and 75 were below average. Lastly, for weighted percentage changes, four corporations had no change, 229 had above-average changes, and 181 were below-average.
This distribution highlights notable variations in enrollment changes across corporations, with weighted metrics showing a larger proportion of above-average changes compared to unweighted metrics. These findings underscore the importance of incorporating weighted analyses to understand systemic enrollment shifts, particularly in larger corporations that exert a more significant influence on overall trends. Additionally, the greater prevalence of below-average unweighted percentage changes suggests that smaller corporations are more likely to experience declines, necessitating targeted interventions to address localized challenges.
| Metric | No Change | Above Average Change | Below Average Change |
| Unweighted Absolute Change | 5 | 230 | 181 |
| Unweighted Percentage Change | 4 | 133 | 277 |
| Weighted Absolute Change | 5 | 336 | 75 |
| Weighted Percentage Change | 4 | 229 | 181 |
Corporations with Notable Enrollment Increases in 2023-24
Table 9 showcases corporations with notable positive changes in both unweighted absolute and percentage enrollment for the year. Clarksville Community School Corporation and Cloverdale Community Schools, both having prominent online school enrollments, experienced the highest unweighted absolute changes with 806 and 789 additional students, respectively, and significant percentage increases of 20.30% and 48.20%. Herron Preparatory Academy recorded the most striking percentage growth at 79.31%, albeit with a smaller absolute change of 138. Corporations like Brownsburg Community School Corp, Northwest Allen County Schools, and others demonstrated modest absolute changes but contributed to steady percentage growth.
This data highlights varying scales of growth across school corporations, reflecting trends in localized enrollment increases. Smaller corporations such as Cloverdale Community Schools exhibit significant relative growth, likely due to targeted initiatives, like online school, or demographic shifts. Larger corporations, such as Brownsburg and Northwest Allen County Schools, show incremental increases that reflect sustained growth trajectories. Policymakers may look to analyze the factors behind these increases to replicate successful strategies across other corporations experiencing enrollment challenges.
| Corporation Name | Unweighted Absolute Change | Unweighted Percentage Change |
| Clarksville Community School Corp* | 806 | 20.30 |
| Cloverdale Community Schools* | 789 | 48.20 |
| Union School Corporation* | 619 | 8.57 |
| Clark-Pleasant Community Sch Corp | 567 | 9.04 |
| Westfield-Washington Schools | 510 | 5.61 |
| Madison-Grant United School Corp | 424 | 28.10 |
| Brownsburg Community School Corp | 258 | 2.60 |
| Northwest Allen County Schools | 224 | 2.75 |
| Greater Clark County Schools | 205 | 2.05 |
| Avon Community School Corp | 202 | 1.96 |
| MSD Washington Township | 200 | 1.93 |
| Kokomo School Corporation | 186 | 3.90 |
| Christel House Academy South | 149 | 18.98 |
| Herron Preparatory Academy | 138 | 79.31 |
| Victory College Prep Academy | 122 | 13.53 |
| Seymour Community Schools | 119 | 2.25 |
| Mt Vernon Community School Corp | 113 | 2.49 |
| Adelante Schools | 112 | 33.94 |
Corporations with the Largest Enrollment Declines in 2023-24
Table 10 highlights corporations experiencing the largest absolute declines in enrollment between 2023 and 2024. South Bend Community School Corp saw the most significant loss, with 924 fewer students, representing a decline of 6.30%. Mitchell Community Schools followed closely, losing 830 students, reflecting a dramatic proportional decline of 56.66%. Other notable absolute losses include Elkhart Community Schools (-407 students, -3.64%) and Rochester Community School Corp (-407 students, -26.51%).
While some corporations like South Bend and Elkhart show modest percentage decreases alongside their large absolute changes, smaller corporations such as Rochester and Argos Community Schools experienced significant percentage declines, indicating sharper enrollment contractions relative to their total size. This highlights how enrollment losses, though varied in scale, pose challenges across different contexts.
Policymakers should focus on these corporations to address factors contributing to significant enrollment declines, such as demographic changes, policy shifts, or local economic conditions. Understanding these drivers is essential for crafting targeted interventions to stabilize or reverse declining trends.
| Corporation Name | Unweighted Absolute Change | Unweighted Percentage Change |
| South Bend Community School Corp | -924 | -6.30 |
| Mitchell Community Schools | -830 | -56.66 |
| Elkhart Community Schools | -407 | -3.64 |
| Rochester Community School Corp | -407 | -26.51 |
| Evansville Vanderburgh School Corp | -347 | -1.63 |
| Hamilton Southeastern Schools | -343 | -1.61 |
| Clinton Prairie School Corporation | -309 | -26.28 |
| MSD Wayne Township | -309 | -1.93 |
| Indiana Connections Academy | -309 | -5.34 |
| Vigo County School Corp | -306 | -2.27 |
| MSD Southwest Allen County Schls | -254 | -3.28 |
| Argos Community Schools | -244 | -36.97 |
| Lafayette School Corporation | -229 | -3.12 |
| School City of East Chicago | -225 | -7.04 |
| Indianapolis Public Schools | -198 | -0.93 |
| Vincennes Community School Corp | -192 | -6.82 |
| Anderson Community School Corp | -187 | -3.12 |
| Michigan City Area Schools | -185 | -3.60 |
| Perry Township Schools | -176 | -1.11 |
| Portage Township Schools | -176 | -2.61 |
| Madison Consolidated Schools | -170 | -6.65 |
| School City of Hammond | -157 | -1.44 |
| MSD Pike Township | -149 | -1.43 |
| South Madison Com Sch Corp | -148 | -3.32 |
| New Albany-Floyd Co Con Sch | -145 | -1.29 |
| North Lawrence Com Schools | -140 | -3.84 |
| Huntington Co Com Sch Corp | -126 | -2.60 |
| 21st Century Charter Sch of Gary | -124 | -9.27 |
| Warrick County School Corp | -117 | -1.17 |
| South Dearborn Community Sch Corp | -115 | -5.91 |
| Alexandria Community School Corp | -112 | -7.63 |
| MSD Steuben County | -112 | -4.46 |
| MSD Decatur Township | -110 | -1.69 |
| Rush County Schools | -107 | -5.67 |
| East Porter County School Corp | -106 | -4.41 |
| Middlebury Community Schools | -106 | -2.51 |
| Gary Community School Corp | -105 | -2.71 |
| Kankakee Valley School Corp | -104 | -3.24 |
| LaPorte Community School Corp | -102 | -1.74 |
Corporations with the Largest Percentage Enrollment Increases in 2023-24
Table 11 highlights corporations experiencing significant percentage increases in enrollment between 2023 and 2024. Monarca Academy recorded the largest percentage gain at 141.46%, despite its modest absolute growth of 58 students. The Genius School and Herron Preparatory Academy followed with 83.78% and 79.31% increases, respectively, reflecting substantial proportional growth. Cloverdale Community Schools experienced a notable absolute gain of 789 students, corresponding to a 48.20% increase. Institutions like GEO Next Generation Academy (42.31%) and Promise Prep (40.58%) demonstrated strong growth rates, while several others, such as Clarksville Community School Corp (20.30%) and Christel House Academy South (18.98%), also achieved significant percentage gains, indicating thriving enrollment patterns in these schools.
These data highlights the varied dynamics of percentage enrollment growth across corporations, with smaller institutions often showing dramatic proportional increases due to their initial size. Larger corporations, while exhibiting more modest percentage changes, nonetheless contribute significantly to total enrollment figures. These trends underscore the importance of tailoring strategies to the unique contexts of different corporations to support sustainable growth and address challenges associated with scaling educational resources.
| Corporation Name | Unweighted Absolute Change | Unweighted Percentage Change |
| Monarca Academy | 58 | 141.46 |
| The Genius School | 62 | 83.78 |
| Herron Preparatory Academy | 138 | 79.31 |
| Cloverdale Community Schools | 789 | 48.20 |
| GEO Next Generation Academy | 66 | 42.31 |
| Promise Prep | 28 | 40.58 |
| Paramount Cottage Home | 93 | 35.09 |
| Adelante Schools | 112 | 33.94 |
| Excel Center - Elkhart | 62 | 33.16 |
| Indiana Department of Correction | 91 | 32.27 |
| BELIEVE Circle City High School | 65 | 30.37 |
| Madison-Grant United School Corp | 424 | 28.10 |
| Dynamic Minds Academy | 24 | 22.64 |
| Springville Community Academy | 37 | 22.16 |
| Indiana Agriculture and Technology | 67 | 21.90 |
| The Hope Academy, Inc. | 7 | 21.21 |
| Indianapolis Metropolitan High Sch | 43 | 20.67 |
| Clarksville Community School Corp* | 806 | 20.30 |
| Christel House Academy South | 149 | 18.98 |
| Neighbors' New Vistas High School | 16 | 17.58 |
| Phalen Leadership Academy at Francis Scott Key 103 | 91 | 16.91 |
| Paramount Online Academy | 28 | 16.87 |
| Geist Montessori Academy | 39 | 16.74 |
| Excel Center - Clarksville | 49 | 15.96 |
| Excel Center - Noblesville | 29 | 15.68 |
| Rooted School Indianapolis | 20 | 14.49 |
| Victory College Prep Academy | 122 | 13.53 |
| Excel Center - Anderson | 36 | 13.24 |
| Excel Center - Lafayette | 42 | 13.04 |
| Excel Center - University Heights | 40 | 12.42 |
| Excel Center - Kokomo | 40 | 11.66 |
| PLA at George H Fisher School 93 | 43 | 11.65 |
| Renaissance Academy Charter School | 28 | 11.38 |
| Excel Center - Shelbyville | 16 | 11.35 |
| Canaan Community Academy | 19 | 10.38 |
| Inspire Academy - A Sch of Inquiry | 18 | 10.23 |
| Options Charter Schools | 92 | 9.86 |
| The PATH School | 51 | 9.43 |
| Purdue Polytechnic High School South Bend | 13 | 9.22 |
| Higher Institute of Arts & Tech | 19 | 9.13 |
| Clark-Pleasant Community Sch Corp | 567 | 9.04 |
| Union School Corporation* | 619 | 8.57 |
| Otwell Miller Academy | 8 | 8.51 |
| Indy Steam Academy | 13 | 7.98 |
| Invent Learning Hub | 13 | 7.83 |
| Allegiant Preparatory Academy | 10 | 6.94 |
| Paramount Brookside | 53 | 6.60 |
| Dugger Union Community School Corp | 34 | 6.00 |
| Hoosier College and Career Academy | 44 | 5.95 |
| Westfield-Washington Schools | 510 | 5.61 |
| Excel Center for Adult Learners | 66 | 5.41 |
| Circle City Prep Charter School | 17 | 5.30 |
| Indiana Academy for Sci Math Hmn | 10 | 5.13 |
Corporations with the Largest Percentage Enrollment Declines in 2023-24
Table 12 captures corporations experiencing notable percentage decreases in enrollment from 2023 to 2024. Mitchell Community Schools recorded the most significant percentage decline of -56.66%, accompanied by a substantial absolute decrease of 830 students. It is important to take caution in relying on the numbers for Mitchell Community Schools as we have reason to believe that these numbers maybe reported incorrectly. Vanguard Collegiate of Indy and Argos Community Schools followed with declines of -43.66% and -36.97%, respectively. Several corporations, including Rochester Community School Corp (-26.51%) and Clinton Prairie School Corporation (-26.28%), also reported notable proportional decreases. Additionally, smaller charter and independent schools like Phalen Leadership Academy - IN Inc (-24.27%) and ACE Preparatory Academy (-21.48%) demonstrated considerable percentage declines, reflecting broader enrollment challenges across different educational institutions.
These data highlights how enrollment decreases, both absolute and proportional, are widespread across corporations of various sizes and types. Smaller corporations often experience sharper proportional declines, which can pose unique challenges given their limited resources and capacities to absorb such losses. Policymakers and stakeholders must consider these dynamics when designing strategies to support struggling corporations, especially those serving vulnerable student populations. Understanding the root causes, such as demographic shifts, policy changes, or local economic factors, is essential for reversing these trends and ensuring equitable educational opportunities for all students.
| Corporation Name | Unweighted Absolute Change | Unweighted Percentage Change |
| Mitchell Community Schools | -830 | -56.66 |
| Vanguard Collegiate of Indy | -31 | -43.66 |
| Argos Community Schools | -244 | -36.97 |
| Rochester Community School Corp | -407 | -26.51 |
| Clinton Prairie School Corporation | -309 | -26.28 |
| Phalen Leadership Academy - IN Inc | -58 | -24.27 |
| ACE Preparatory Academy | -32 | -21.48 |
| Phalen Virtual Leadership Academy | -61 | -17.43 |
| Gary Middle College | -27 | -15.34 |
| Timothy L. Johnson Academy Middle | -28 | -14.36 |
| Aspire Charter Academy | -90 | -13.51 |
| Cannelton City Schools | -27 | -12.92 |
| Lawrence County Independent Schools | -31 | -12.76 |
| Liberty Grove Schools | -29 | -12.50 |
| Excel Center - Gary | -17 | -11.72 |
| Global Preparatory Academy | -83 | -11.22 |
| Excel Center - Hammond | -19 | -9.74 |
| Charles A Tindley Accelerated Sch | -38 | -9.72 |
| Eminence Community School Corp | -28 | -9.56 |
| 21st Century Charter Sch of Gary | -124 | -9.27 |
| Alexandria Community School Corp | -112 | -7.63 |
| Steel City Academy | -26 | -7.58 |
| Vision Academy | -32 | -7.48 |
| Phalen Leadership Academy at Louis B Russell 48 | -21 | -7.47 |
| Purdue Polytechnic High Sch North | -21 | -7.42 |
| Taylor Community School Corp | -93 | -7.42 |
| School City of East Chicago | -225 | -7.04 |
| Vincennes Community School Corp | -192 | -6.82 |
| North Newton School Corp | -74 | -6.65 |
| Madison Consolidated Schools | -170 | -6.65 |
| Tri-Township Cons School Corp | -20 | -6.49 |
| Excel Center - Bloomington | -8 | -6.45 |
| Scott County School District 1 | -80 | -6.34 |
| Phalen Leadership Academy Middle School | -18 | -6.34 |
| South Bend Community School Corp | -924 | -6.30 |
| East Gibson School Corporation | -43 | -6.14 |
| Central Noble Com School Corp | -70 | -6.12 |
| Lake Ridge New Tech Schools | -97 | -5.99 |
| South Dearborn Community Sch Corp | -115 | -5.91 |
| Rush County Schools | -107 | -5.67 |
| Andrew J Brown Academy | -34 | -5.63 |
| Tindley Genesis Academy | -23 | -5.48 |
| Gary Lighthouse Charter School | -61 | -5.41 |
| Indiana Connections Academy | -309 | -5.34 |
| Success Academy Primary School | -32 | -5.30 |
| North Judson-San Pierre Sch Corp | -48 | -5.16 |
School Corporations with Less than 1000 Student Population
Table 13 presents data on Indiana school districts/corporations including public charter schools with enrollments below 1,000 students in 2024, an issue recently debated in state legislative discussions about resource allocation and the viability of small schools. A total of 167 school districts/corporations fall into this category, with 91 districts/corporations experiencing a negative unweighted absolute change in enrollment from 2023 to 2024. These declines highlight concerns regarding sustainability and operational efficiency, potentially influencing future policy decisions. Meanwhile, some schools, despite their small enrollments, have shown positive growth, indicating potential opportunities for tailored interventions or strategies to foster success in small-scale educational settings.
This table illustrates the varied enrollment dynamics among small corporations. While declining enrollments are prevalent, some corporations demonstrate growth, suggesting that specific factors, such as community engagement or specialized programs, may contribute to their success. Policymakers and stakeholders should consider these dynamics when formulating strategies to address challenges faced by smaller districts/corporations, ensuring equitable resource distribution and supporting innovative approaches to improve educational outcomes.
| Corporation Name | 2024 Enrollment | Unweighted Absolute Change |
| Herron Charter | 998 | 3 |
| Southwest Parke Com Sch Corp | 982 | 27 |
| Fremont Community Schools | 981 | 1 |
| MSD Boone Township | 975 | -28 |
| MSD of New Durham Township | 948 | 4 |
| South Central Com School Corp | 942 | -8 |
| Triton School Corporation | 935 | 8 |
| Christel House Academy South | 934 | 149 |
| Flat Rock-Hawcreek School Corp | 929 | -34 |
| Irvington Community School | 925 | -19 |
| Rossville Con School District | 924 | -12 |
| West Washington School Corp | 921 | 7 |
| North Judson-San Pierre Sch Corp | 882 | -48 |
| Pioneer Regional School Corp | 882 | -32 |
| Clinton Central School Corporation | 874 | 8 |
| Southern Wells Com Schools | 874 | -4 |
| Clinton Prairie School Corporation | 867 | -309 |
| Orleans Community Schools | 867 | -24 |
| Randolph Eastern School Corp | 864 | 4 |
| North White School Corp | 862 | -1 |
| Covington Community School Corp | 858 | 27 |
| Paramount Brookside | 856 | 53 |
| Thea Bowman Leadership Academy | 849 | 9 |
| Caston School Corporation | 846 | 16 |
| Anderson Preparatory Academy | 843 | -21 |
| South Newton School Corp | 842 | 11 |
| Wes-Del Community Schools | 840 | 14 |
| Springs Valley Com School Corp | 822 | -11 |
| Bloomfield School District | 801 | -29 |
| Rising Sun-Ohio Co Com | 799 | 29 |
| South Henry School Corp | 789 | 37 |
| Edinburgh Community School Corp | 788 | -12 |
| Cowan Community School Corp | 786 | -5 |
| Hoosier College and Career Academy | 784 | 44 |
| Culver Community Schools Corp | 783 | -6 |
| North Miami Community Schools | 780 | 15 |
| Northeast Dubois Co Sch Corp | 769 | -5 |
| Tri-Central Community Schools | 769 | 0 |
| Jac-Cen-Del Community Sch Corp | 760 | 14 |
| Loogootee Community Sch Corp | 758 | 18 |
| Tri-County School Corporation | 755 | 19 |
| Northeast School Corp | 740 | 8 |
| Indiana Connections Career Academy | 724 | -21 |
| Lanesville Community School Corp | 718 | -26 |
| KIPP Indy Unite Elementary | 708 | 13 |
| White River Valley School District | 693 | -14 |
| Enlace Academy | 676 | 18 |
| Charter School of the Dunes | 674 | -10 |
| Western Wayne Schools | 669 | -17 |
| Burris Laboratory School | 668 | -13 |
| North Vermillion Com Sch Corp | 662 | -11 |
| MSD Shakamak Schools | 658 | 14 |
| East Gibson School Corporation | 657 | -43 |
| Global Preparatory Academy | 657 | -83 |
| Frontier School Corporation | 644 | -2 |
| Matchbook Learning | 642 | 1 |
| Rock Creek Community Academy | 637 | -24 |
| Mitchell Community Schools | 635 | -830 |
| Phalen Leadership Academy at Francis Scott Key School 103 | 629 | 91 |
| Shoals Community School Corp | 623 | -12 |
| West Central School Corp | 615 | -21 |
| Southwestern Con Sch Shelby Co | 602 | 13 |
| Dugger Union Community School Corp | 601 | 34 |
| IN Math & Science Academy - North | 600 | -31 |
| The PATH School | 592 | 51 |
| SE Neighborhood Sch of Excellence | 583 | 10 |
| Purdue Polytechnic High School Ind | 578 | 11 |
| Blue River Valley Schools | 577 | -18 |
| Aspire Charter Academy | 576 | -90 |
| Success Academy Primary School | 572 | -32 |
| Andrew J Brown Academy | 570 | -34 |
| Hammond Academy of Science & Tech | 551 | -13 |
| Discovery Charter School | 544 | -25 |
| IN Math & Science Academy | 535 | -4 |
| Seven Oaks Classical School | 514 | 2 |
| Attica Consolidated School Corp | 505 | -14 |
| Oregon-Davis School Corp | 498 | 8 |
| Christel House Academy West | 491 | 19 |
| Community Montessori Inc | 483 | -17 |
| James and Rosemary Phalen Leadership Academy High School | 482 | 8 |
| Randolph Southern School Corp | 472 | -3 |
| East Chicago Lighthouse Charter | 462 | -11 |
| Career Academy High School | 448 | 17 |
| Adelante Schools | 442 | 112 |
| Crothersville Community Schools | 433 | 16 |
| East Chicago Urban Enterprise Academy | 430 | 7 |
| Argos Community Schools | 416 | -244 |
| PLA at George H Fisher School 93 | 412 | 43 |
| Career Academy Middle School | 400 | 6 |
| Herron-Riverside High School | 398 | -11 |
| Tindley Genesis Academy | 397 | -23 |
| Vision Academy | 396 | -32 |
| Timothy L Johnson Academy | 393 | 5 |
| KIPP Indy Legacy High | 386 | 9 |
| Excel Center - Kokomo | 383 | 40 |
| Signature School Inc | 378 | -15 |
| Indiana Department of Correction | 373 | 91 |
| Indiana Agriculture and Technology | 373 | 67 |
| KIPP Indy College Prep Middle | 369 | -3 |
| Excel Center - Lafayette | 364 | 42 |
| Excel Center - University Heights | 362 | 40 |
| Excel Center - West | 359 | 12 |
| Paramount Cottage Home | 358 | 93 |
| Excel Center - Clarksville | 356 | 49 |
| Charles A Tindley Accelerated Sch | 353 | -38 |
| Hamilton Community Schools | 346 | 1 |
| Circle City Prep Charter School | 338 | 17 |
| The Bloomington Project School | 321 | -9 |
| Paramount School of Excellence South Bend | 317 | NA |
| Steel City Academy | 317 | -26 |
| Avondale Meadows Academy | 315 | 14 |
| Herron Preparatory Academy | 312 | 138 |
| Excel Center - Anderson | 308 | 36 |
| Phalen Virtual Leadership Academy | 289 | -61 |
| Tri-Township Cons School Corp | 288 | -20 |
| Excel Center - Muncie | 283 | 10 |
| BELIEVE Circle City High School | 279 | 65 |
| Renaissance Academy Charter School | 274 | 28 |
| Geist Montessori Academy | 272 | 39 |
| Indiana School For The Deaf | 270 | -6 |
| James & Rosemary Phalen Leadership Academy Middle School | 266 | -18 |
| Eminence Community School Corp | 265 | -28 |
| Purdue Polytechnic High Sch North | 262 | -21 |
| Phalen Leadership Academy at Louis B Russell School 48 | 260 | -21 |
| Joshua Academy | 253 | -11 |
| Indianapolis Metropolitan High Sch | 251 | 43 |
| Excel Center - Elkhart | 249 | 62 |
| Paramount Englewood | 228 | -5 |
| Higher Institute of Arts & Tech | 227 | 19 |
| Tindley Summit Academy | 225 | -1 |
| GEO Next Generation Academy | 222 | 66 |
| Excel Center - Noblesville | 214 | 29 |
| pilotED Schools | 213 | 6 |
| Lawrence County Independent Schools | 212 | -31 |
| Indiana Academy for Sci Math Hmn | 205 | 10 |
| Excel Center - Richmond | 204 | -6 |
| Springville Community Academy | 204 | 37 |
| Liberty Grove Schools | 203 | -29 |
| Canaan Community Academy | 202 | 19 |
| Avondale Meadows Middle School | 201 | 9 |
| Paramount Online Academy | 194 | 28 |
| Inspire Academy - A Sch of Inquiry | 194 | 18 |
| Premier Arts Academy | 191 | NA |
| Medora Community School Corp | 188 | -7 |
| Excel Center - South Bend | 184 | 4 |
| Cannelton City Schools | 182 | -27 |
| Phalen Leadership Academy - IN Inc | 181 | -58 |
| Invent Learning Hub | 179 | 13 |
| Damar Charter Academy | 179 | 0 |
| Excel Center - Hammond | 176 | -19 |
| Indy Steam Academy | 176 | 13 |
| Paramount School of Excellence Lafayette | 173 | NA |
| Timothy L. Johnson Academy Middle | 167 | -28 |
| Rooted School Indianapolis | 158 | 20 |
| Excel Center - Shelbyville | 157 | 16 |
| Southside Sp Srvs Of Marion Co | 156 | 7 |
| Purdue Polytechnic High School South Bend | 154 | 13 |
| Allegiant Preparatory Academy | 154 | 10 |
| Gary Middle College | 149 | -27 |
| The Nature School of Central Indiana | 145 | 3 |
| The Genius School | 136 | 62 |
| Dynamic Minds Academy | 130 | 24 |
| Excel Center - Gary | 128 | -17 |
| Mays Community Academy | 117 | -3 |
| ACE Preparatory Academy | 117 | -32 |
| Excel Center - Bloomington | 116 | -8 |
| Excel Center - Southeast | 107 | NA |
| Neighbors' New Vistas High School | 107 | 16 |
| Otwell Miller Academy | 102 | 8 |
| Monarca Academy | 99 | 58 |
| Promise Prep | 97 | 28 |
| IN Sch for the Blind & Vis Imprd | 95 | -1 |
| Success Academy at Boys and Girls Club | 89 | NA |
| Smith Academy for Excellence | 76 | 3 |
| NW Indiana Special Education Coop | 71 | NA |
| Vanguard Collegiate of Indy | 40 | -31 |
| The Hope Academy, Inc. | 40 | 7 |
| The Portage School of Leaders | 19 | NA |
| Christel House DORS | 0 | 0 |
Conclusion
This report provides a comprehensive analysis of student enrollment trends in Indiana school corporations and charter schools from 2006 to 2024, with a focused examination of changes observed between 2023 and 2024. The findings reveal notable patterns of growth and decline, emphasizing the diverse and evolving nature of Indiana's educational landscape. The data highlight key trends that have significant implications for policymakers, educators, and community stakeholders.
The long-term analysis from 2006 to 2024 indicates systemic enrollment declines in many Indiana school corporations. Urban districts/corporations such as Indianapolis Public Schools and Gary Community School Corporation experienced the most pronounced declines in both absolute and percentage terms, underscoring persistent challenges related to demographic shifts, economic changes, urban outmigration, and the growth of competing options in charter schools and voucher-funded private schools. In contrast, some suburban districts/corporations, including Hamilton Southeastern Schools and Brownsburg Community School Corporation, exhibited steady growth, driven by expanding communities and attractive school programs. Charter schools and smaller corporations also reported dramatic percentage increases, though these were often from a relatively small initial student population. The use of both weighted and unweighted metrics in the analysis provided a nuanced perspective, capturing the distinct dynamics of large and small corporations alike.
The most recent enrollment trends from 2023 to 2024 reflect a broader pattern of stagnation, with an average absolute enrollment change of -12.57 students per corporation and a slight percentage increase of 1.05%. While the overall numbers suggest stability, individual corporations experienced significant fluctuations. Some districts/corporations achieved substantial enrollment gains, while others faced notable declines, reflecting localized demographic changes, housing development patterns, and policy impacts. Small corporations with enrollments under 1,000 students faced particular challenges; nearly half reported enrollment declines, raising concerns about their sustainability. However, certain small corporations, such as Christel House Academy South and Dugger Union Community School Corp, demonstrated resilience and growth, emphasizing the potential for success even in resource-constrained environments.
The legislative context surrounding small school corporations adds further significance to these findings. Recent policy discussions on consolidating or supporting small corporations underscore the importance of tracking enrollment trends to guide equitable funding and sustainable development. The findings highlight the critical need for targeted policy interventions that support operational efficiency, resource equity, and educational innovation for these smaller institutions.
Overall, the report underscores the complex and dynamic nature of student enrollment patterns in Indiana schools. Policymakers and stakeholders must leverage these data-driven insights to inform strategies that address both localized and systemic challenges. Strategic investment in growth areas, targeted support for struggling districts/corporations, and customized policies for small corporations can help stabilize and strengthen Indiana’s diverse educational ecosystem. By adopting a holistic and evidence-based approach, decision-makers can better navigate the ever-changing educational landscape, ensuring that every student has access to quality education regardless of location or district/corporation size.
References
Hamid, M., Moore, M., & Lubienski, C. (2024, February).Examining the impact of school choice programs on enrollment shifts: Winners and losers in Indiana (Policy Brief 24-1). Center for Evaluation and Education Policy, Indiana University Bloomington. https://education.indiana.edu/research/centers/ceep/education-policy/policy-briefs/2024/school-choice-in-indiana.html
Indiana Business Research Center. (2024, September-October).Indiana's school-age population projections: 2020 to 2050. InContext. https://www.incontext.indiana.edu/2024/sept-oct/article2.asp
Indiana Department of Education. (2024).Data Center & Reports. https://www.in.gov/doe/it/data-center-and-reports/
Klein, A. (2024, January 8).Behind public school enrollment declines. K-12 Dive. https://www.k12dive.com/news/behind-public-school-enrollment-declines/642719/